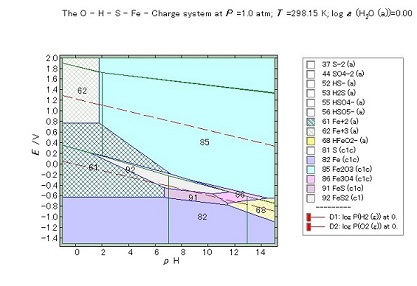
Diagram Example : Pourbaix Diagram for Fe-S-O-H-e- system at 298.15 K
The chemical potential diagram for the Fe-S-O-H-e- system:
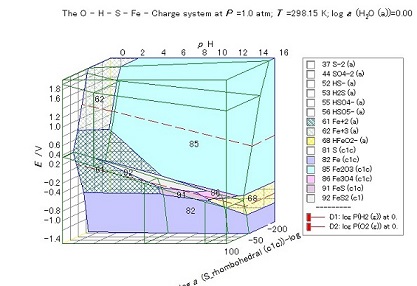
- The Pseudobinary Pourbaix diagram in the pH-E/V-{log a(S)-log a(Fe)} plot.
The Z axis is completely ignored in the pseudobinary system. The stable polyhedrons for the S containing but Fe non-containing species are treated as a transparent polyhedron with network-bone(edges) structure.
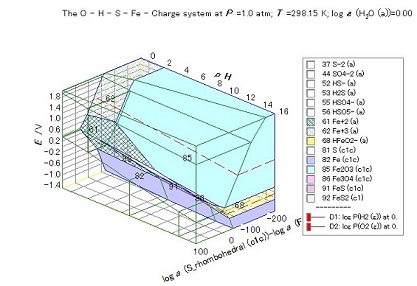
- the normal threedimensional Pourbaix diagram.
The same equilibrium relations are plotted in the three dimensional coordinates. It is clearly indicated that the transparent sulfur species are located in the left-hand side in the Z axis.
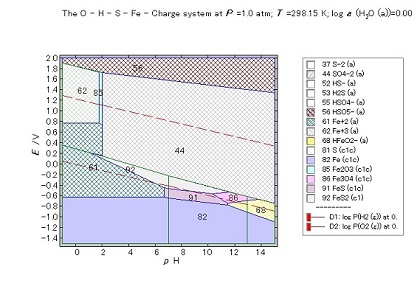
- the triangle type three dimensional Pourbaix diagram.
- the pseudobinary Pourbaix diagram under the management of transparency.
Procedure Description
change in coordinates range
pH
E/V
log a(s) - log a(Fe)