-
287. Li-Mn-O:
(a) Zhang, W., Cupid, DM., Gotcu, P., Chang, K., Li, D., Du, Y., Seifert, HJ., Chem. Mater. 30, 2287-2298 2018.
(b) Wang, M., Navrotsky, A., J. Solid State Chem. 178, 1230-1240 2005.
(c) Wang, M., Navrotsky, A., J. Solid State Chem. 178, 1182-1189 2005.
(d) Cupid, DM., Li, D., Geberet, C., Reif, A., Flandorfer, H., Seifert, J., J. Ceram. Soc. Japan 124(10), 1072-1082 2016.
(e) Paulsen, JM., Dahn, JR., Chem. Mater. 11, 3065-3079 1999.
(f) Luo, C., Martin, M., J. Mater. Sci. 42, 1955-1964 2007.
-
In the Li-Mn-O system, some series of solid solutions are also included as pseudo individual compounds. Some stoichiometric compounds can be regarded as the end-member of the ideal solutions consisting of several different compositions. To keep a reasonable mixing entropy in such solutions, some stoichiometric compounds are described in a smaller molecular chemical formula.
- Stoichiometric compounds
-
LiMn2O4.5 should be 1/2 {Li2Mn4O9}
LiMn1.75O4 should be 1/4 {Li4Mn7O16}
Li1.333Mn1.667O4 should be 1/3 {Li4Mn5O12}
Li2MnO3
LiMn2O4
- Individual compounds in a series of Li1-xMn2O4
Several compositions in this series are added:
-
Mn2O4
Li0.125Mn2O4
Li0.25Mn2O4
Li0.375Mn2O4
Li0.5Mn2O4
Li0.75Mn2O4
Li0.875Mn2O4
LiMn2O4
- Individual compounds in a series of Li1+xMn2-xO4
Several compositions in this series are added:
-
LiMn2O4
Li0.9Mn2.05O4
Li0.8Mn2.1O4
- Individual compounds in a series of Li1-2xMn2+xO4
Several compositions in this series are added:
-
LiMn2O4
Li1.1Mn1.9O4
Li1.2Mn1.8O4
Li1.3Mn1.7O4
Li1.333Mn1.667O4: 1/3 {Li4Mn5O12}
- Room temperature phase relations have been investigated in order to understand the electrochemical behavior. Typical observations in the Li battery with the Li-Mn-O positive electrode are:
- The electrode voltage around 3 V is attributed to the electrode reaction between LiMnO2 and LiMn2O4.
- The electrode voltage around 4 V is attributed to the reaction between LiMn2O4 and Mn2O4.
- The electrode voltage around 3 V is attributed to the electrode reaction between LiMnO2 and LiMn2O4.
- The voltage change associated with the first reaction is given as the stepwise change so that the stoichiometric compounds are participated, whereas those in the second reaction are changed smoothly so that the solid solutions among Mn2O4, LiMn2O4, and Li4Mn5O12(here Li1.333Mn1.667O4) in the spinel crystal lattice are considered to be those reactions.
Several phase relations can be set up based on the present set of the MALT database.
- LiMnO2-LiMn2O4-Mn2O4 line
-
The simplest relations associated with the electrochemical behavior can be set up by excluding MnO2 and other compounds listed below.
- Note that the borderline between LiMnO2 and LiMn2O4 is given as the constant value of the log a(Li).
- This borderline is necked by Mn3O4 and Li2MnO4.
- The border between LiMn2O4 and Mn2O4 consists of several phases belonging to the Li1-xMnO4 solid solutions, indicating that the equilibrium voltage during charge/discharge is given as a function of the Li content in Li1-xMn2O4 solid solutions.
Table 1. Excluded compounds in addition to MnO2


Fig. 1 CHD Diagram for the Li-Mn-O system at room temperature with a focus on the electrochemically related phases
- Note that the borderline between LiMnO2 and LiMn2O4 is given as the constant value of the log a(Li).
- Effects of stable phases No.1
-
First, the effect of Li1-xMn2-xO4 phases is considered in the following two cases:
- Those phases appear just at the neighbor to the LiMn2O4, indicating that those phases are part of the solid solutions with LiMn2O4.
- The interesting point is that the appearance of those Li1-Mn2-xO4 phases leads to hindering extensively the border region of LiMn2O4 and Mn2O4.
- This well corresponds to the discussion that the actual composition line associated with the electrochemical charge/discharge processes may be on the Li-rich side in the spinel triangle composition region. Accordingly, the Li1-xMn2-xO4-Mn2O4 borderline is shifted to the more negative lithium activity side.

Fig. 2(a) CHD Diagram for Li-Mn-O system at room temperature:
Li1.1Mn1.9O4 is added to the above case.

Fig. 2(b) CHD Diagram for Li-Mn-O system at room temperature:
Li1.2Mn1.8O4 and Li1.333Mn1.667O4 are added to the above case.
- Those phases appear just at the neighbor to the LiMn2O4, indicating that those phases are part of the solid solutions with LiMn2O4.
- Effects of stable phases No.2: Full equilibrium
-
Next, the phase relations are derived under the full equilibrium condition; that is, no exclusion will be applied.
- Although the LiMn2O4 phase appears in the middle region, no phases associated with the 4V class electrode reaction appear in the chemical potential diagram.
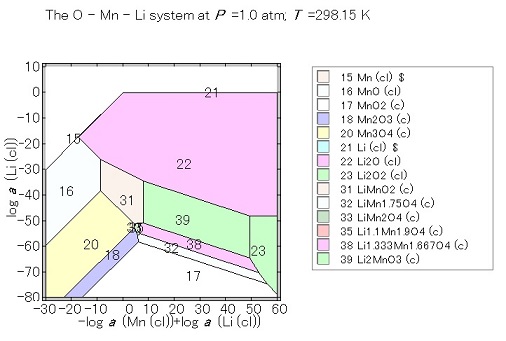
Fig. 3 CHD Diagram for Li-Mn-O system at room temperature:
Full equilibrium.
- Phase diagram in the plot of the lithium content vs temperature was derived as follows:
-
First, the experimentally determined high-temperature phase diagram is given below.
- Although the horizontal variable is given by the ratio of Li in (Li+Mn), the valence values in phases are quite different.
- For example, Li2MnO3 has the tetravalent Mn valence even around 1273 K.
- In LiMn2O4, the valence is about 3.5.
- With deceasing temperature, the Mn valence in Li1+xMn2-xO4 phases increases to 4 at the Li4Mn5O12.
- In Mn3O4, the Mn valence is 2*2/3.
- Around 673 K, LiMn1.75O4 and Li0.33MnO2 phases appear as those stable phases at lower temperatures.
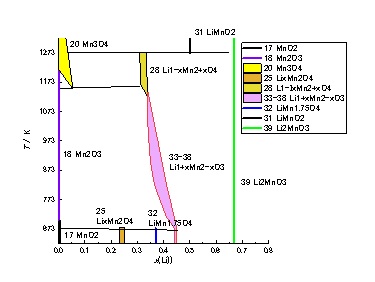
Fig. 4 Phase Diagram for the Li-Mn-O system in air at high temperatures:
Full equilibrium.
- Although the horizontal variable is given by the ratio of Li in (Li+Mn), the valence values in phases are quite different.
- Chemical Potential diagram at high temperatures in air.
-
For the following two cases, chemical potential diagrams are prepared.
- at 1300 K, three phases(Mn3O4, LiMnO2 and Li2MnO3) are stable.
- around 1200 K, LiMnO2 decomposes into Li0.8Mn2.1O4 and Li2MnO3 in good agreement with Fig. 4 above.
- The composition of the cubic spinel phase changes from Li0.8Mn2.1O4 to Li1.333Mn1.667O4 with decreasing temperature; this behavior is also essentially the same as that in Fig. 4.
- around 670 K, LiMn1.75O4 appears between MnO2 and Li1.333Mn1.667O4 in good agreement with Fig. 4.
- Even so, no Li1-xMnO2 phase appears in the above chemical potential diagram.
- Around 420 K, Li0.25Mn2O4 appears.

Fig. 5(a) CHD Diagram for Li-Mn-O system at high temperatures in air:
Full equilibrium.

Fig. 5(b) CHD Diagram for Li-Mn-O system at high temperatures in air:
Excluding MnO2, LiMn1.75O4 phases.
- at 1300 K, three phases(Mn3O4, LiMnO2 and Li2MnO3) are stable.
-
The present derivation of the thermodynamic properties in the Li-Mn-O system was made on relying on the high temperature phase relations as well as those electrochemical behaviors which must be obtained under non-fully equilibrated conditions.