-
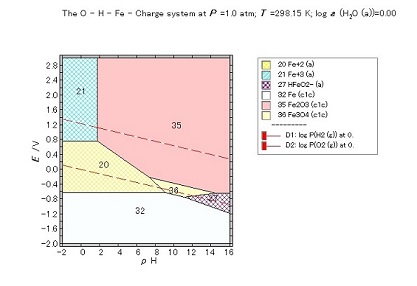
(1) The Pourbaix diagram in the pH-E/V plot.
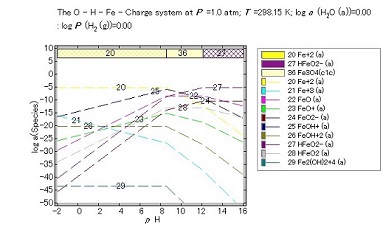
(2)The profile diagram of 5a at the dissection of p(H2) = 1 atm.
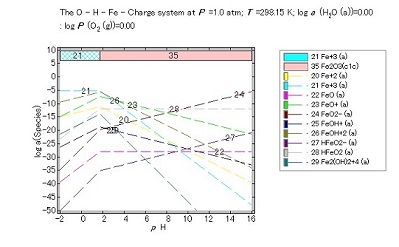
(3)The profile diagram of 5a at the dissection of p(O2) = 1 atm.
to top Details
- Default conditions are
- a(H2O)=1;
- For aqueous species log a=-5 except for water related species.
- Iron containing aqueous species and condensed phases are targetted.
- Condensed phases are shown in solid colored polygons,
whereas aqueous species are given in bsDiagCross.
In a normal Pourbaix diagram, the logarithmic concetration of the target element in the aqueous slution can be plotted. Here, however, the thermodynamic activities are used in calcutions. Thus, there can be small differences between two values. For example, we consider Fe2(OH)2+4(a). When Fe2(OH)2+4(a) exists as a = 10-5. When the total amount of Fe in solution should be calculated, this Fe2(OH)2+4(a) should be acounted as double because two Fe contains in one mole of Fe2(OH)2+4(a). Namely, c(Fe)=2*10-5.
- Dissection data
- Dissection data are shown as the red dashed lines for the conditions of
-
p(H2)= 1 atm ;
p(O2)= 1 atm ;
-
pH=0 and E/V = 0.
The 5a(1) diagram shows that this line goes through the polygons of
-
20 Fe+2(a)
36 Fe3O4(c)
27 HFeO2-(a).
In the 5a(2) profile diagram, those aqueous and condensed phases are shown in the upper part of the diagram. The calculated logarithmic activities of aqueous species show changes in slope at the borderlines of these species.
- a(H2O)=1;
to top Description
-
[System] MALT 
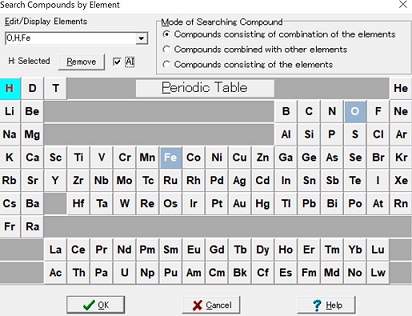
Search Compounds
-
Selection of <Fe,O,H> system with aqueous species
| MALT |
|
Tools > CHD | with CHD parameter of "/md" |
|
|
Run > One Dissection |
-
Selection of log p(H2) at 0;
Check the profile diagram and then the following appears
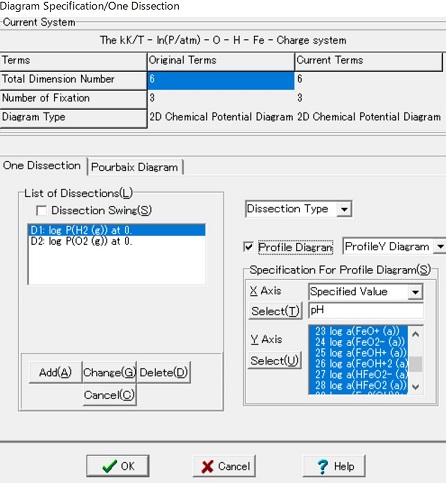
This leads to the formation of the another profile diagram.