MALT TOP
Diagram Example : Ellingham Diagram for S-O, S-H-O, C-S-O systems
to S-H-O system
to S-C-O system
Literature
- Haruo Kishimoto, Teruhisa Horita, Katsuhiko Yamaji, Manuel E. Brito, Yue-ping Xiong, and Harumi Yokokawa, Sulfur Poisoning on SOFC Ni Anodes: Thermodynamic Analyses within Local Equilibrium Anode Reaction Model, J. Electrochem. Soc., 157(6), B802-B813 (2010).
doi:10.1149/1.3362896
(1)The Ellingham diagram for the S-O system:
Description
Details
- Diagram
(1)The two dimensional Ellingham Diagram in the T vs. ΔG(O2) plot.
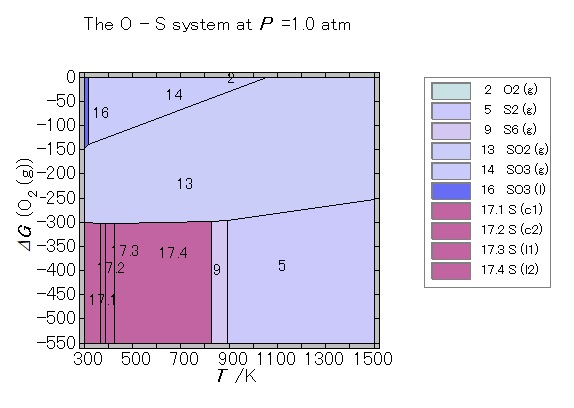
Fig. 1 The Ellingham Diagram for the S-O system.
-
Description
to top
Details
- The Ellingham diagram is convenient and important to provide a whole
feature of elemental behavior in a wide range of temperature and oxygen potential.
- Sulfur has the solid and liquid states. For respective states, the lambda transition appears in the heat capacity so that these states are divided into two substates.
- Sulfur oxides are present as liquid state (SO3) as well as many gaseous states.
- The Ellingham diagram properly shows which gaseous species becomes dominat in
the region of the T-Δ G(O2) plane. In this sense, we can call this diagram the predominant area diagram for the high temperature field in a anologous way to those diagrams in the aqueous field.
-
Details
to top
Description
- [System] MALT
 Search Compounds
Selection of <S,O> system
- MALT
Tools > CHD with CHD parameter of "/md"
-
CHD
Project > Specify Diagram
- Dimension Selection page
- Diagram Selection page
Click Default bottun twice to select T and Gibbs energy axes.
-
Diagram > Range
Modify the range for axes.
-
Project > CHD Options
- Diagram Details page
- check on Use of Brightness 150 for solid abd 200 for gas
- No check on Use of Brushstyle.
Here no use of Brushstyle is selected, just because the copied legendle
for bsBDiagonal is not well shown in the help htm files.
-
Diagram > Colar Details
- Tricolor by stroichiometry is selected
(2)The Ellingum diagram for the S-H-O system:
to S-O system
to S-C-O system
Description
Details
- Diagram
(1)The three dimensional Ellingham diagram for S-H-O system
(a)
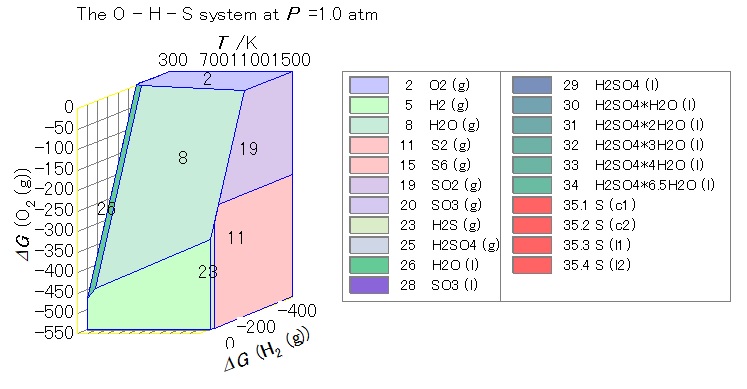
Fig. 2a Three dimentional diagram for the S-H-O system. No.1. Without
any transparency of compounds.
(b)
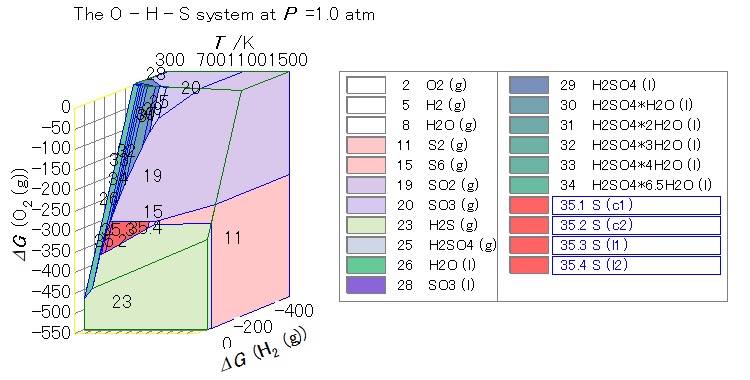
Fig. 2b Three dimensional diagram for the S-H-O system. No. 2. With tranparent
H2(g), O2(g), and H2O(g)
(c)
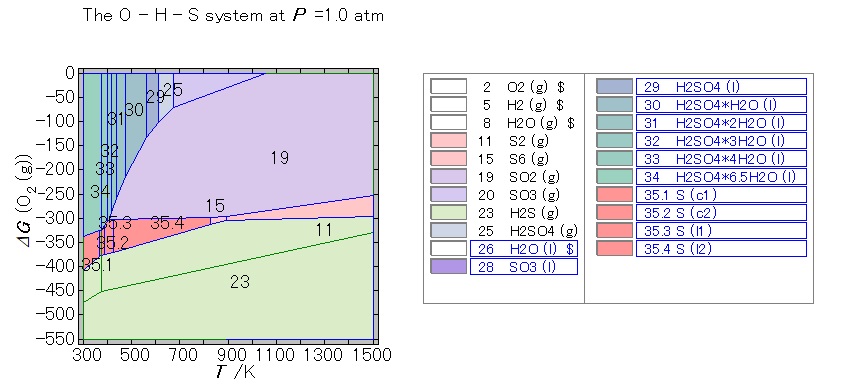
Fig. 2c Three dimensional diagram for S-H-O system. No. 3. Two dimensional
display.
(d)
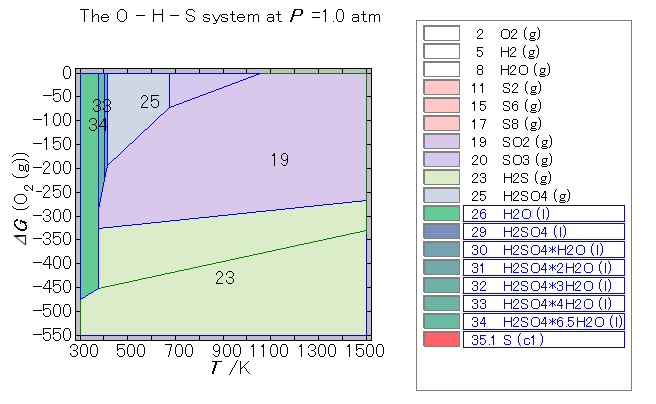
Fig. 2d Three dimensional diagram for S-H-O system. No. 4. Two dimensional
display with selecting the sulfur containing gaseous species at 10-6 atm.
-
Description
to top of page
to top of S-H-O system
Details
- The three dimensional Ellingham diagram for the S-H-O system is apparently look like to those diagram for H-O system. The species of O2(g), H2O(g) and H2(g) are the dominant species in addition to the H2O(l) stable state.
- Stable sulfur containing species are displayed as polyhedron inside the shown polyhedron consisting of O2(g), H2O(g) and H2(g).
- In order to look into the sulfur containing species, it is necessary to make those polygons of O2(g), H2O(g) and H2(g) transparent.
- Diagram (c) can be regarded as the Ellingham diagram for sulfur. Here, the borderline btween the dominant species are displayed.
- The stable region of those dominat species are strongly influenced by the partial pressure of gaseous species.
-
Details
to top of page
to top of S-H-O system
Description
Figure (a)
[System] MALT
Search Compounds
Selection of <S,C,O> system
MALT
Tools > CHD with CHD parameter of "/md"
-
CHD
Project > Specify Diagram
- Dimension Selection page
- Diagram Selection page
- Click Default bottun twice to select T and Gibbs energy axes. There appear one temperature axis and three Gibbs energy ases.
- Select the three dimensional diagram.
Figure (b) Making compounds transsparent
- Start the mode of transparent on
- Method 1
Diagram > Display Mode > Touch Diagram
- Method 2 Use of popupmenu which appears by right^hand click of mouse on the legend box.
Select Transparent on
- Select compounds to become tranparent
Confirm that the mode is selected to be touch diagram. This is displayed in tool bar or the upper left corner of the diagram display panel.
- Method 1
Click on the compound to be transparent in the Legendle.
- Method 2
View > Graph Inspection Compounds page
Click on the compound to be transparent in the page.
Note that this mode is primarily to touch diagram to see the details of chemical potential values. When mouse touched diagram not legendle, the chemical potential table will appear.
- End of the tranparent on mode
- Method 1
Diagram > Display Mode > Normal
- Method 2 Use of popupmenu which appears by right^hand click of mouse.
Select Transparent off
- Change location of the compound numbers in the diagram
- Method
Diagram > Display Mode > Change Location
Figure (c)
-
Diagram > Rotation
The default button provides three modes 1(XY_Z) 2(XY) 3(x_Y_z).
Select 2(XY).
Figure (d)
-
Project > Chemical System Select Compounds page
Check the Specify Activity(Gas) and then
Actibity Specification box appears
- Change log (p) value from 0 to -6
- Remove checks from the O and H remaining only S.
(3)The Ellingum diagram for the S-C-O system:
to S-O system
to S-H-O system
Description
Details
- Diagram
(1)The three dimensional Ellingham diagram for C-S-O system
(a)
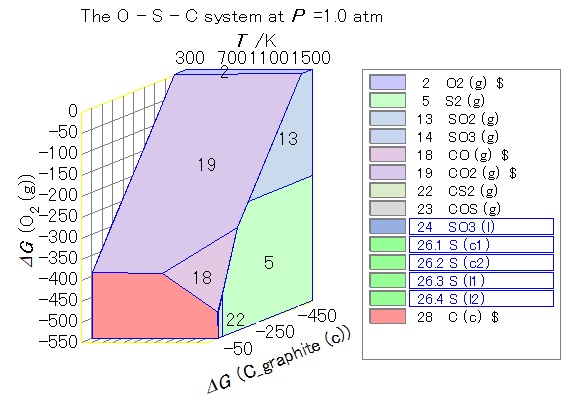
Fig. 3a Three dimentional diagram for the C-S-O system. No.1. Without
any transparency of compounds.
(b)
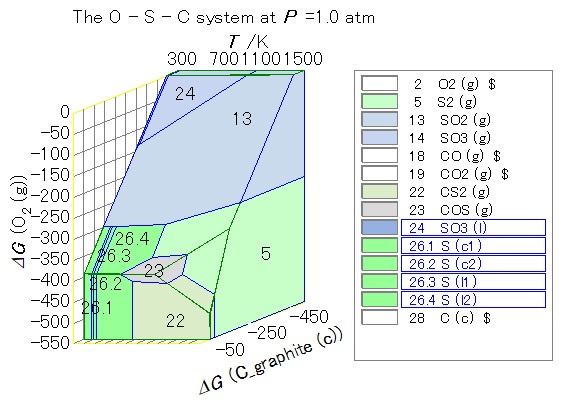
Fig. 3b Three dimensional diagram for the C-S-O system. No. 2. With tranparent
O2(g), C(c), CO(g), CO2(g)
(c)
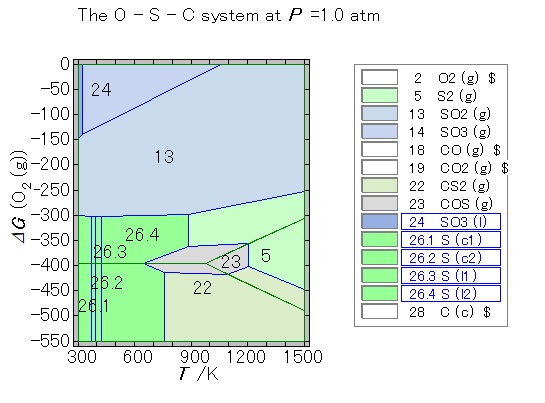
Fig. 3c Three dimensional diagram for C-S-O system. No. 3. Two domensional
display.
(d)
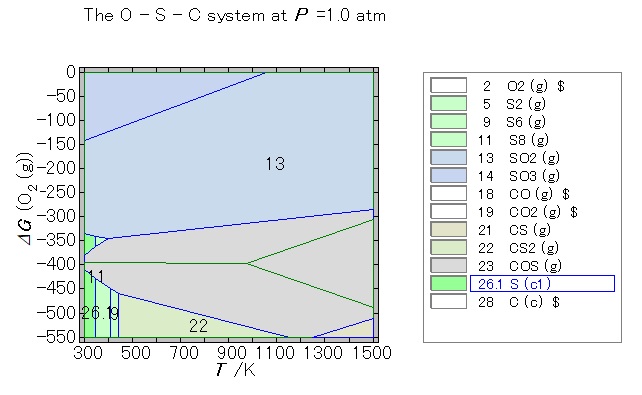
Fig. 3d Three dimensional diagram for C-S-O system. No. 4. Two dimensional
display with selecting the sulfur containing gaseous species at 10-6 atm.
-
Description
to top of page
to top of S-C-O system
Details
- Similar diagrams to above figures can be set up for the C-S-O system. In the oxidative side, similar chemical species become dominant, whereas in the reducing atmosphere, some different features appears.
- In the C-S-O system, COS and CS2 are the major gaseous species.
-
Details
to top of page
to top of S-C-O system
Description
|
[System] MALT |
|
Search Compounds
|
Selection of <C,S,O> system
|
MALT |
|
Tools > CHD |
with CHD parameter of "/md" |
- CHD starts to do the first task of "Malt Direct." in a similar manner.
- A different point is to change the sequence of the diagram axes.
- The second (Y) axis of dG(S) should be replaced with dG(C) which appears in the Z axis.