- (a) Modaressi, A., Kael, J.C., Malaman, B., Gerardin, R., Gleitzer, C., Mat. Res. Bull. 18, 101-109 1983.
- (b) Zhang, L., Schlesinger, M.E., Brow, R.K., J. Am. Ceram. Soc. 94, 1605-1610 2011.
- (c) Ong, S.P., Wang, L., Kang, B., Ceder, G., Chem. Mater. 20, 1798-1807 2008.
- (d1) Shi, Q., Zhang, L., Schlesinger, ME., Boerio-Goates, J., WoodField, BF., J. Chem. Thermodyn. 62, 35-42 2013.
- (d2) Shi, Q., Zhang, L., Schlesinger, ME., Boerio-Goates, J., Woodfield, BF., J. Chem. Thermodyn. 61, 51-57 2013.
- (d3) Shi, Q., Zhang, L., Schlesinger, ME., Boerio-Goates, J., Woodfield, BF., J. Chem. Thermodyn. 62, 86-91 2013.
- (e) Iyer, RG., Delacourt, C., Masquelier, C., Tarascon, JM., Navrosky, A., Electrochem. Solid State Lett. 9(2), A46-A48 2006.
- (f) Loos, S., Gruner, D., Abdel-Hafiez, M., Seidel, J., Huettl, R., Wolter, AUB., Bohmhammel, K., Merterns, F., J.Chem. Thermodyn. 85, 77-85 2015.
- (g) Shimizu, D., Nishimura, S., Barpanda, P., Yamada, A., Chem. Mater. 24, 2598-2603, 2012.
Fig. 1a Fig. 1b Fig. 2 Fig. 3a Fig. 3b Fig. 4 Description Details
-
(1a)The three dimensional Diagram for the Li-Fe-P-O system
- Simmilarly to the corresponding diagram in 9a Fig.1, there appear the Fe2O3-P2O5, FeO-P2O5 and mixed valence subsystems.
- In the Fe2O3-P2O5 system, 48 Fe(PO3)3, 54 Fe4(P2O7)3, 46 FePO4 appear.
- In the FeO-P2O5 system, 50 Fe2P2O7, and 52 Fe3(PO4)2 appear. In 9a, many double oxides are calculated and show to be stable.
- In the mixed valence series, 49 Fe2(PO4)O, and 56 Fe7(P2O7)3 appear. In a similar manner to 9a_Fig. 1, those oxides are in equilibrium with Fe2O3.
- In the Fe2O3-Li2O subsystem, 72 Li5FeO4, 69 LiFeO2, 70 LiFe5O8 are stable, whereas 71 Li2Fe3O5 appears without contact with FeO because FeO is unstable at 298.15 K.
- In the Li2O-P2O5 sybsystem, three doubleoxides are stable, that is, 66 LiPO3, 67 Li3PO4, 68 Li4P2O7.
- In the Li-P system, four Li phosphides are stable. 61 LiP, 63 LiP7, 64 Li3P, 65 Li3P7. In the diagram, LiP is not shown in terms of compound number. This is just because the area of this compound is too small to give the compound information.
- Several compounds are made transparent. Those are 58 Li, 59 Li2O, 60 Li2O2, 66 LiPO3, 67 Li3PO4, 68 Li4P2O7.
- Among 8 stable quarternary compounds, 73 LiFePO4, 74 LiFeP2O7, 76 LiFe2P3O10, 77 Li2FeP2O7,79 Li3Fe2(PO4)3, and 80 Li9Fe3(P2O7)3(PO4)2 can be seen in this view.
- The interface between 77 Li2FeP2O7 and 74 LiFeP2O7 is important in the lithium batteries field.
- Further transparent compounds are selected. Those are 79 Li3Fe2(PO4)3 and 80 Lo9Fe3(P2O7)(PO4)2. Under these compounds, 46 FePO4 appears and confirms that this phase is in equilibrium with 73 LiFePO4
- One dissection at log p(O2)=-52 is displayed. This can be compared with the original three dimensional diagram with a red dissected line. In the dissection diagram, the transparent compound is displayed with white color instead of transparency.
- By using the swing of dissection value, those phase relations change according to the selected value.
_1a.jpg)
Fig. 1a The Diagram with axes of O-Li-Fe
(1b)The three dimensional Diagram for the Li-Fe-P-O system
_1.jpg)
Fig. 1b The Diagram with axes of O-Li-Fe: Compare with 9a Fig.2
(2)The three dimensional Diagram for the Li-Fe-P-O system
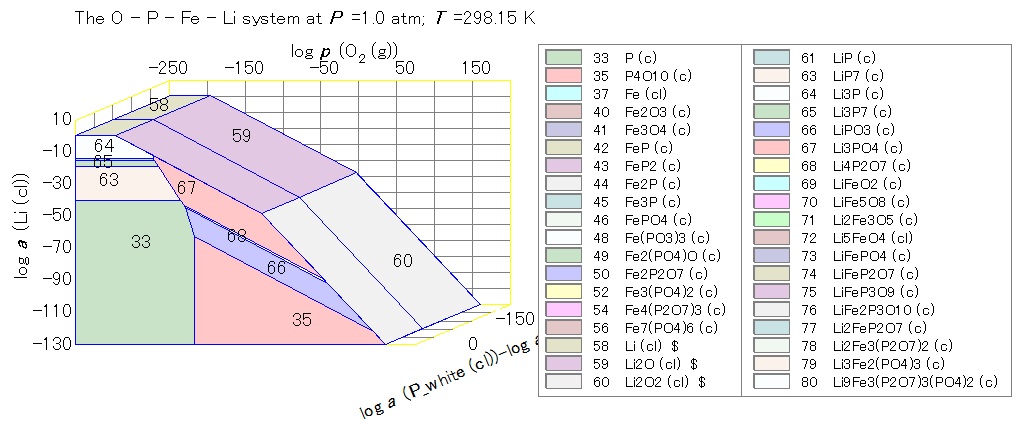
Fig. 2 The Diagram with axes of O-Li-P/Fe: Compare with 9a Fig.3
(3a)The three dimensional Diagram for the Li-Fe-P-O system
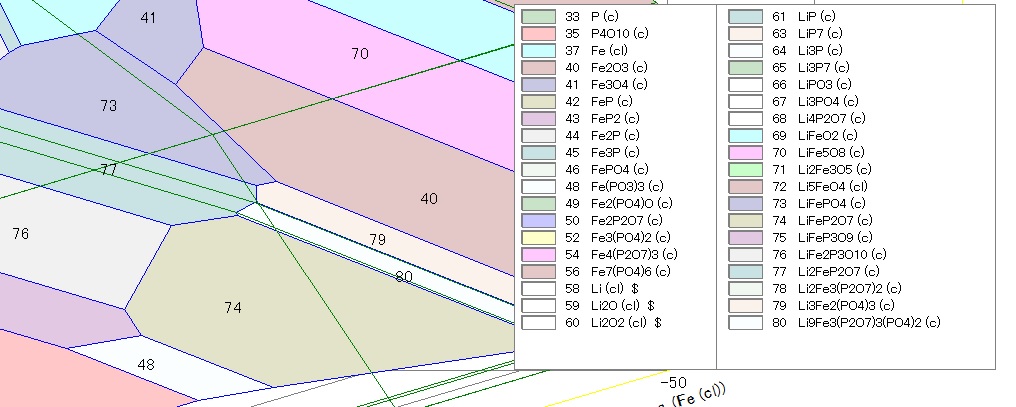
Fig. 3a The Diagram with axes of O-Li-P/Fe
(3b)The three dimensional Diagram for the Li-Fe-P-O system
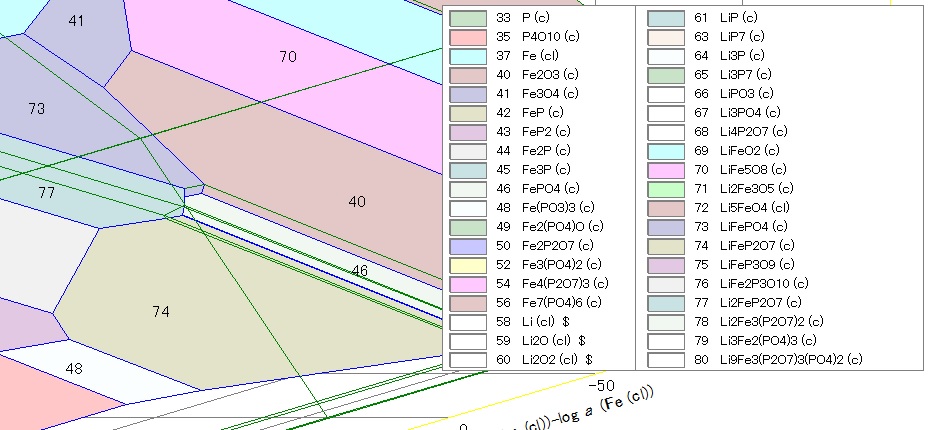
Fig. 3b The Diagram with axes of O-Li-P/Fe
(4)The three dimensional Diagram for the Li-Fe-P-O system with Dissection at log (pO2)=-52
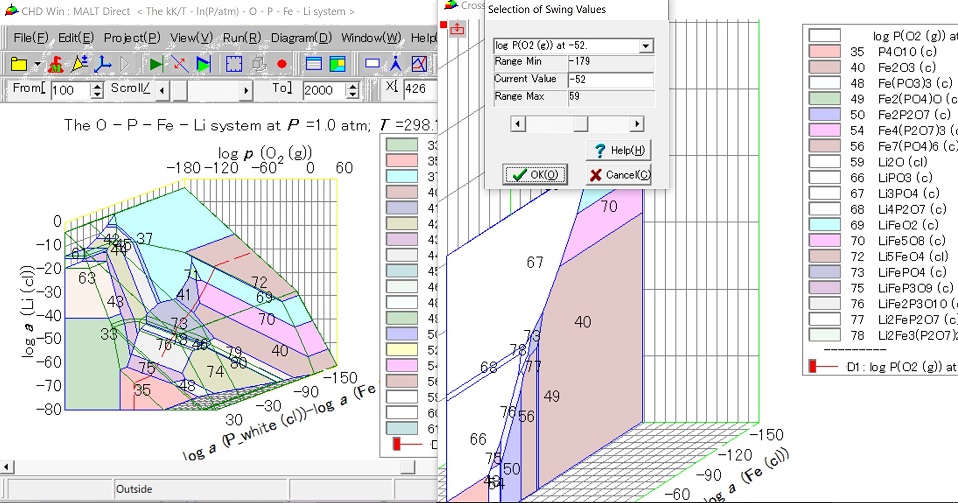
Fig. 4 The Diagram with axes of O-Li-P/Fe with Dissection at log(pO2)=-52
Diagram 9b Details
- Multicomponent phase equilibria and evaluation of the thermochemical properties
- As described above and in Example 9a, the precise considerations are needed to obtain the consistent set of data. When the well examined phase relations have been derived, the evaluation is not so difficult.
- Even so, the accumulated knowledge on the lower number of component systems are not well enough, the evaluation of higher systems becomes impossible. In this sense, the basaic framework of the thermochemical network is extremely important. In this sense, we rely on the NBS thermochemical data (reference 1) although it becomes already 40 year old.
- Graphical as well as numerical representation of equilibria
- In the multicomponent system, one way of handling equilibria is to make chemical equilibrium calculation, that is, use gem in the MALT system.
- Graphical representation is also another important means. In order to make full use of this approach, CHD provides several ways. Three dimensional diagram, making polyhedron transparent, dissection, touch on visible plane to know the chemical potential information, etc.
- Electrochemical Behavior
- The electrode reacion in the lithium batteries can be written down as follows:
-
A(in electrode) = Li+(in electrolyte) + B(in electrode) + e-
-
μ(Li) = μ◦(A)-μ◦(B)
- LiFePO4/FePO4
-
Look at Fig. 3b. compound numbers 73 and 46.
- Li2FeP2O7/LiFeP2O7
-
Look at Fig. 3b; compound numbers 77 and 74
- The electrode reacion in the lithium batteries can be written down as follows:
Diagram 9b Description
-
[System] MALT 
Search Compounds -
Selection of <Li,Fe,P,O> system
-
MALT Tools > CHD with CHD parameter of "/md" - CHD starts to do the first task of "Malt Direct."
- For the non-aqueous system, the default setting was made to
construct the Chemical Potential diagram at 298 K.
- CHD starts to do the first task of "Malt Direct."
-
Project > Specify Diagram - Dimension Page No need to modify the temperature value.
- Diagram Type page
- Click Default button once.
- Fig. 1a : No change in the coordinates
- Fig. 1b :
-
Move log a(Li) to the second (Y) axis,
Move log a(Fe) to the third (Z) axis.
- Fig. 2 :
-
Move log a(Li) to the second (Y) axis,
Focus log a(P) on; click Change button and select log a(Fe) making log a(P) - log a(Fe) as third (Z) axis.
- Run
- Making Compound polyhedrons transparent
- Start the transparency mode on
Two ways of using legendbox:
- First: Mouse right-hand side click on the legend box.
- Select Display mode of touchD:
- click touchD button in View > Toolbar > Display mode .
-
Diagram > Display Mode >
Touch Diagram
- The same menu can be found by right click of mouse on the diagram display area.
- Start with Graphinspector: compound page
View > Graph Inspector
- Select compound in the legend box or in Graphinspector
- Click on the compound name to be change between making transparent on or off.
- After click, the diagram will be redrawn.
- Start the transparency mode on
Two ways of using legendbox:
- One Dissection
- Select
Run > One Dissection
- in (5) One Dissection page
- Click Add button
- Select O2(g) and set the value 0f log p(O2)=-52.
- Check on the Profile diagram. Then coordinates box appear. Default setting will be accepted.
- Swing
- The selected value can be changed by selecting swing mode.
This can be made- by clicking the checkbox in the One Dissection page.
- or selcting the swing menu: Run > One Dissection Swing
- The selected value can be changed by selecting swing mode.
- Appearance
- In main diagram: the dissected line is displayed on the visualized diagram. When some polyhedrons are made transparent, the line will not shown in such polyhedrons. When the swing value is changed, the corresponding dissected line is also moved according to the selected value.
- In dissected diagram: If the same coordinates are adopted as in the main diagram, the dissected diagram will move.
-
The transparent compounds are displayed by white color not by transparent. This is because the transparency in the two dimensional diagram is not critically important. It is better to show where this compound presents.
- Manupulation
- The display mode can be selected for respective diagrams shown in the separate panels/forms. Selection of display mode can be made easily by right-hand side clicking on the diagram display field and appearing popupmenus.
- Since the display mode requires the movement of the mouse, it is essential to know which diagram is the current focus in relations to the mouse movement.
- this is shown in the upper-left corner of diagram display panel by red marker and selected display mode.
- To change the focus to other diagram, the mouse click should be made on the diagram to be focussed.
- Zoom up
-
Fig. 3 was made by using Zoom up mode.
- Mouse click indicates that the diagram will be redrawn so that the selected point becomes to be center of thedisplay field.
- At the same time, zoom up leads to the enlargement of diagram scale.
- Zoom uo, down +- will be ended when the normal mode is selected.
- Select