MALT TOP
Diagram Specification Dialog
Diagram Specification Dialog
provides tools for detemining the fundamental conditions which are needed to specify the diagram type to be constructed.
- OK and Cancel buttons are normal and
Help button provides details how diagram type should be selected on the basis of the current system summarized in the upper part.
- The lower part consists of several pages for constructing initially a diagram and for further examination by dissections;
- Message Panel
The message will be given, if necessary, after a plausible wrong selection was made by user. The most of messages are quite undesrstandable except followings:
- When the temperature is input in the Dimension page, the message about 'Exclude due to no HT data, or 'Warning of Out Of Temperature Range' will be given in some times. For details, see the explanation for the treatment of compounds having limited validity for temerature range.
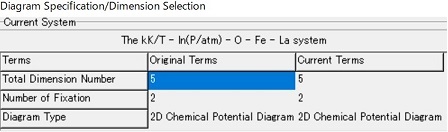
Current System
- Total Dimension Number : The thermodyanmic space consistes of temperature, pressure and selected elements. This is displayed in the title.
- Number of Fixation : The original number is that on start this dialog, while the current number corresponds that under modification. This is the sum of the fixed non-chemical potential variables to be determined in the page of "Dimension Selection" and the fixed chemical potentials to be determined in the page of "Fixation".
- Diagram Type : Drawable types of diagram depend on difference beteen the total number of components (dimensions) and the number of fixed variables in the system.
Table Examples of diagram in various types
- Default Setting
When the input data was given from MALT Direct or a file, the default setting for selection of diagram and related options was adopted.
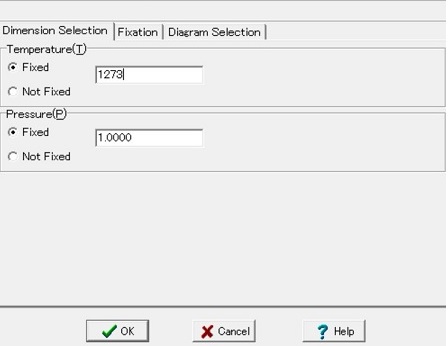
(1) Dimension selection page
To Top
(1) Dimension selection page
(2) Fixation page
(3) Diagram selection page
(4) Pourbaix Diagram page
(5) One Dissection page
(6) Many Dissections page
(7) Additional Lines page
(8) Manual Dissection (comment)
- The thermodynamic intensive variables can be divided into two categories; that is, the chemical potentials and others such as temperature and pressure. Here, non-chemical potential variables can be specified about whether or not those variables are fixed at selected values.
- Method :
- To fix at a value, check "fixed" and edit the field in the right hand side.
- To cancel the fixation, check "not fixed". Then, the text value in the edit field will disappear.
- Temperature
:
Unit is in K.
Default = Fixed at 298.15 K.
- Case for not fixed
- Respective states: When the CHD Options for respective states is checked in
the CHD Options: general page,
the checke box of Respective states will appear.
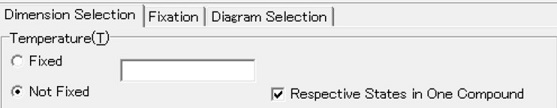
- It is highly recommended to select the respective states as checked in order to construct the proper diagram. See 'Example Diagram 7a.
- Pressure
:
Unit is in atm.
Default = Fixed at 1 atm.
- Electrical Potential :
This option will be never used. Even when the system containing the aqueous species, this option will not be used.
Instead, the charge will be treated as a pseudoatm. This will appear as the last of the element list. In the aqueous system, the electrical potential, E/V, or alternatively, pE can be selected for fixation or for coordinate.
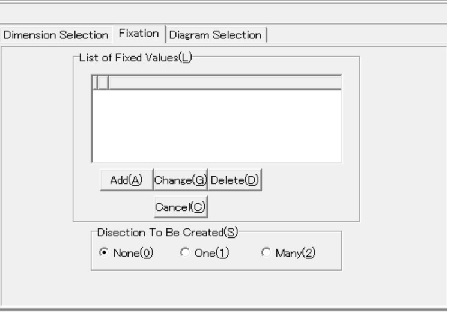
(2) Fixation page
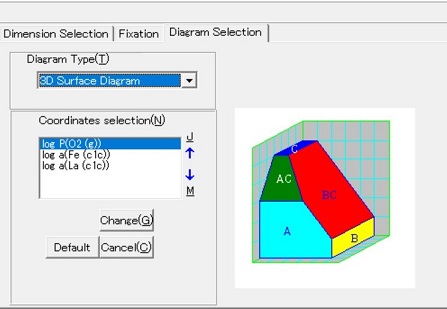
(3) Diagram selection page
- Diagram Type Selection:
The diagram type can be selected here among the available types; see Examples. A typical image is given for the selected diagram type in the right hand side of the dissplay panel.
Drawable diagrams are given as a function of the difference between total dimension number and the fixation number:
2 : 2D surface diagram, Profile diagram
3 : 2D chemical potential diagram, 3D surface diagram
4 : 3D chemical potential diagram
When selection of diagram type is violated against the above rules, messages will be shown in the message panel above the Diagram Selection page.
- Specification of the Profile Diagram
Further specification will be needed when the profile diagram or the 3D chemical potential diagram will be selected as follows:
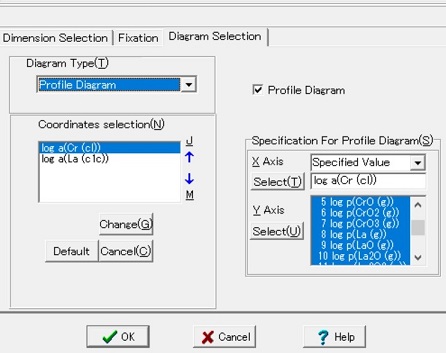
After selection of profile diagram as Diagram Type, checkbutton of Profile Diagram will appear to select valuables associated with the profile diagram:
- X Axis : Selection can be made among the given items for Coordinate Type . For the profile diagram, the following can be selected:
- absolute distance: Distance in the chemical potential space is calculated for any two points and then distance for any point can be counted from the start point.
- Specified value: Selection is made among the available compound value in a similar way to select a coordinate axis of the chemical potential diagram.
Select: When the specified value is selected for the X axis, the selection of associated compounds and related coefficeints can be selected here. The selected value is shown in the list box.
- Y Axis :
Select: Selection can be made using the select compound table; results are shown in the list box.
- 3D Diagram Type Selection
In the three dimensional chemical potential diagram, there is one options to be determined concerning how to project the three dimensional diagram on the two dimensional plane.
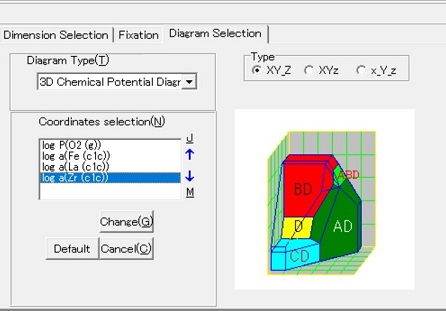
Detailed adjustment can be made in the menu of Rotation or in the [Rotation of 3D diagram] Dialog. Even so, CHD provides three types of default schemes:
- XY_Z, normal :
- XYz, pseuso binary:
- x_Y_z, Triangle:
Specification for this option can be made here in the [Fixation Diagram] Dialog, in the [Rotation of 3D diagram] Dialog, or in the [CHD Options] / Diagram Details (Options for three dimensional diagram.
-
Coordinates Selection
The default coordinates are usually given. Three coordinates are needed even for the two dimensional diagram. Similarly, the three dimensional diagram needs four coordinate valuables. Note that this corresponds to the difference between the total dimension number and the fixation number:
The following bottuns/arrows are available:
- Change : Change or reselection can be made for the focused coordinate. Selection is made on the selection of dimension variable or compound variable and on the coefficient of the selected dimension/compound.
- Default : Default Coordinates will be selected among those dimensional variables which are not fixed. Default selection provides one of the available coordinates based on the diemnsion variable or the corresponding elemental compound like O2(g), Fe(c), or La(c).
For those systems without selecting temperature, defualt setting provides three cases: elemental potential vs inverse temperature, logarithmic activity of the elemental compound vs inverse temperature and the Gibbs energy of elemental compound vs. temperature.
- Cancel : All changes which were made during the current modification will be cancelled.
- Arrows:


Downward or upward arrows make exchange the selected line and the lower or the upper line, respectively.
- No function is available for add nor delete here.
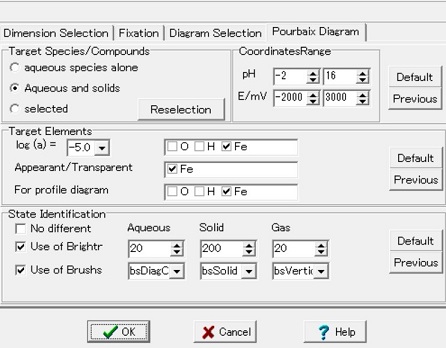
(4) Pourbaix diagram page
- This page collects the options relating to the specification of the Pourbaix diagram for the aqueous system.
- Whenever the non-standard generalized diagram will be calculated for the aqueous systems,
the normal procedures for constructing the generalized chemical potential diagrams will be needed.
- In such a case, no diagram will be automatically shown.
- Thus, pages(1),(2),(3) should be used in specifying the conditions for diagram construction.
- Target Species / Compounds and Coordinates Range
- Target Species / Compounds ragiogroup: When the stability area of the aqueous species and compounds wil be calculated, targets can be selected. For example, the aqueous species alone are selected, the predominance area diagram can be set up. Or the aqueous species and solid compounds are selected, the normal POurbaix diagram for the solid -aqueous solution equilibria can be set up.
Alternatively, users can freely select the species/compounds to be calculated by using the
Reselection button. By clicking theis button, the list of species/compounds appears to show the selected ones.
- Coordinates Range
The Maximum and Minimum values of the coordinates can be changed and stored by using those spin buttons for
pH and E /mV .
- buttons
the Default button resets the selection for target and coordinates range values using the default selection/values. On the other hand, the Previous button recover those selection/values before editing in the session.
- Target Elements
- log A values of aqueous species are changed to this value during the calculations. When the log A value is a large negative value like -12, the stability region of the aqueous species usually expands to the solid stable area.
Activity Targets indicate that those species containing the targeted elements are included in calculation. Usually the elements conposing the solvent, namely,hydrogen and oxygen are excluded from this targetting.
- Stability Targets are important when the Pourbaix diagram for the multi-component systems such as Fe-S-O-H-e system will be calculated and shown. Usually, the Fe containing species/compounds will be displayed in the diagram, whereas the S containing species/compounds are neglected. In the Pourbaix diagram written in CHD, claculations will be made by including those S containing species/compounds but those species are not show explicitely but as the transparent polygon/polyhedrons; that is, only the bone-like structure is presented. By selecting this stability targets or appearant/transparent taregets, these treatments can be changed. Note that the hydrogen and oxygen are alway excluded in this option.
- Profile Diagram : This is targets for the profile diagram in which gaseous or the aqueous species are plotted as line as a function of chemical potential.
- buttons: Default button prepares the setting based on the default values, whereas Previous button can recover the values before starting edition.
- State Information
- No difference check is for no use of Brightness nor brushstyle for distinguishing aqueous, solid and gaseous species.
- Use Of Brightness check and
Use Of Brushstyle check make it possible to select brightness and brushstyle for respective species of
Aqueous;
Solid, and
Gas.
- Buttons:
Default button and
Previous button are available.
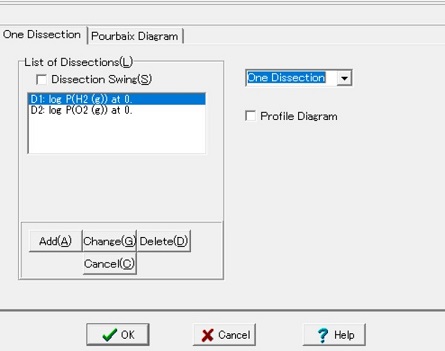
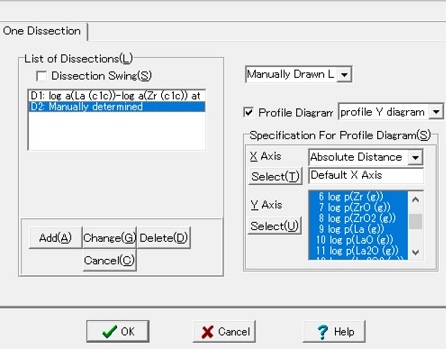
(5) One Dissection page
- This page is for determining the specific condition of dissecting the present available diagram.
- One dissection will be made.
- For the three dimensional surface diagram and the two-dimensional diagrams, such dissection can be plotted on the target diagram.
- In addition, the profile diagram can be created in the different display panel.
- List Of Dissections :
This panel collects items for detemination of dissection and also show the current status of the dissections not only for one dissection but other type of dissections.
- Check box for Dissection Swing :
Dissection can be made by selecting compounds and their coefficients and also by specifying the value.
This dissecting value can be changed by manipulating this value in the [Selection of Swing Value]dialog.
When check is made on this check box, the dissection diagram will be shown in the presence of the [Selection of Swing Value] Dialog.
- List box
This list box lists up all kind of dissections specified on the present chemical potential diagram. When one dissection is focused, the type of the dissection is shown in the above combobox. Depending on this type, the rest of the right hand side of panel may change to show associated items to be determined.
- Buttons :
- Add : This is for adding "one dissection" by using [Select One Dissection] Dialog which will appear after clicking the Add button.
- Change : This is to change the already added dissection which is currently focused. Before clicking this button, the target dissection should be selected in the list and be focused.
- Delete : The presently selected dissection will be deleted. The associated diagram also will be deleted.
- Cancel : Cancel will be made in the present editing dissections.
By setting the One dissection, there appear two effects:
- Dissected Line(s) on the parent chemcial potential diagram.
This line is shown as a red line, while this may be changed in color on swinging value.
- Additional diagram is ceated depending on the number of freedome; that is, two different diagrams are created:
- a profile diagram will be created when the dissection is represented as a line. The logarithmic activity of gaseous or aqueous species, log p, or log a, will be plotted as a function of variable driven for the dissected line. Typical variable is the X-axis of the parent chemical potential diagram.
- the dissected two dimensional or three dimensional diagram will be created. When the parent chemical potential diagram is the three dimensional chemical potential diagram, the same coordinates can be selected for the dissected diagram.
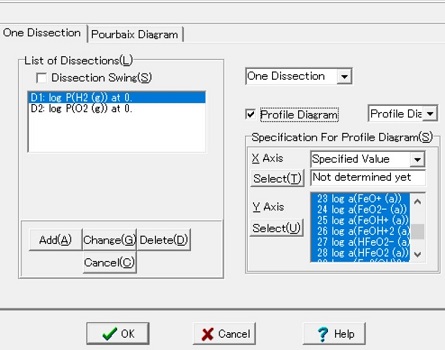
- Profile Diagram
When the dissected diagram should be displayed in the additional diagram display panel, this check box should be checked. Then, further selection should be made on the followings:
- Diagram type Selection : selection should be made among the available combobox items, if necessary.
- Specification For profile diagram: This is for determination of the coordinates of the profile diagram. The X axis is the chemical potential variable, whil the Y axis is the logarithmic activity (partial pressure) of the selected species.
- X-Axis Coordinate Type should be selected among
- Absolute distance: This is calculated for distance in the chemical potenial space between two points.
- Specified value: Usually this is based on the coordinate varialbes in the parent chemical potential diagram.
- Selection for the X-Axis : The default variable is derived from the parent chemical potential diagram. Other variables can be selected in a similar manner to the determination of coordinate.
- Selection for the Y-Axis can be made by selecting the species:
Selection button is for displaying the popup menu List of Points > Selection of Column for selecting species/compounds for Y variables.
- For dissected diagram(2D or 3D)
- Coordinates should be selected among the selected variables. Those candidates are coordinates used in the parent diagram.
- Note that when other coordinate variable is selected, there are possibility that artificial planes used in cutting the variable range can appear.
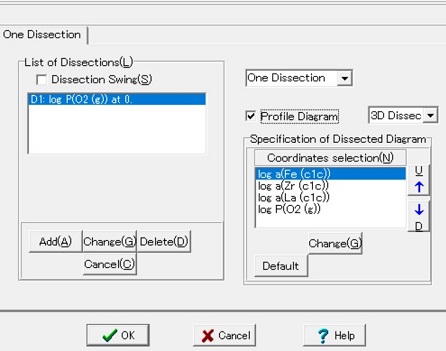
(6) Many Dissections page
This is for defining the conditions to make many dissections simultanesouly on the different display forms. Since it is rather difficult to obtain good conditions for this option, it is highly recommended to prepare conditions by first attempting "one dissection", if neccesary, with the option of Swing.
The procedure for obtaining "many dissections" is about the same as for "One dissection" described above.
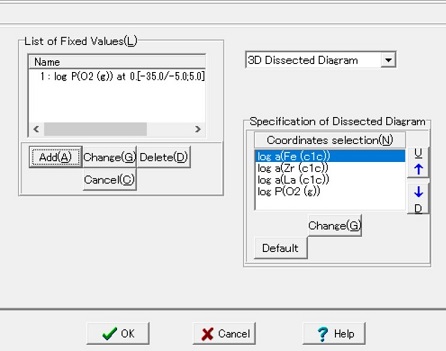
- Specification of dissection plane: List of Fixed Values :
Selection of Dissection plane is made in the list of Fixed values:
- listview of disection plane
This list shows the dissection plane together with the range of fixed values.
One plane data will be focused and the associated information will be displayed in the righthand sie.
- Buttons
- Add : This is for adding the "Many Dissection" by using [Select Many Dissections] Dialog which will appear after clicking this button. When a compound and its coefficient (or a set of this combination) is selected, default setting will be made for the initial, the final and the step value to make a series of dissections.
- Change : This is to change the already added dissection which is currently focused. Before clicking this button, the target dissection should be selected in the list and be focused.
- Delete : The presently selected dissection will be deleted. The associated diagram also will be deleted.
- Cancel : Cancel will be made in the present editing dissections.
- Definition of dissected diagrams.
- Dissection diagram type should be selected among
- Dissected 2D diagram : the two dimensional diagram will be constructed. Two coordinates should be active.
- Dissected 3D diagram : the three dimensional diagram will be constructed in a series. Usually the same coordinates as those in the parent diagram are adopted.
- Specification of Dissection Diagram
- Coordinates : Initially the same coordinates are displayed. Those can be arranged here for the dissected diagram.
- Buttons and arrows
- Change
- Default : default coordinates are the same as those in the target(parent) coordinates.
- Upward Arrow : the focused coordinate can be moved upwards.
- Downward Arrow : the focused coordinate can be moved downwards.
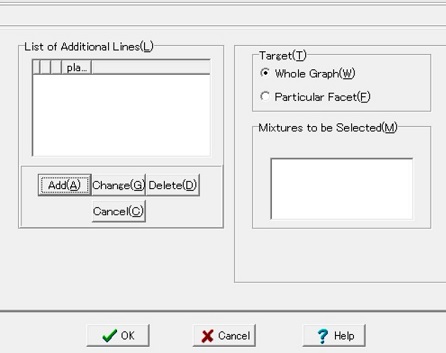
(7) Additional Lines page
This is for defining the conditions to make additional lines on the target diagram. Since the additional lines will be drawn on the constructed diagram by using the specification of the chemical potentail or the logarithmic activities, this can be regarded to draw the isoactivity lines. Note that not only the mixture phases but also individual compounds system can be targeted to drow this kind of lines.
Procedure will be made by the following two parts:
- Selection of additional planes
- ListView of additional lines
Compound(s) and its range of fixed values are displayed. The focused line is selected by clicking on the line. The corresponding setting for the target phases/mixture will be displayed in the right hand side (Definition of values of additional plane). The focused line can be edited (changed) or deleted using buttons.
- Buttons
- Add : The "additional Lines" is selected by using "[Select Additional Lines] Dialog which will appear after clicking. Selection of a compound and its coefficient will be made together with range of fixed values in a similar way to the Many dissections."
- Change
- Delete
- Cancel
- Definition of values of additional plane
- Target : Selection is made betwee "Whole Graph" and "Particular Facet" corresponding to particular plane(compound). Whe the latter is selected, the selection is further made on which mixture phases will be targeted.
- Mixture to be Selected
Note that selection of Additional lines plane is made by focusing one line in the list of Fixed values in the left hand side.
(8) Manual dissection in "One Dissection"
The management of the draw lines can be made in the "One Dissection" page.
- list
The draw lines are managed as one of many dissection related things. Since no compound is used in the drawing line, the title is given as "manually determined."
- Specification of profile diagram
At respective points, the logarithmic activity can be calculated for selected species/compounds. Those data can be plotted as a function of X-axis variable. As default X axis variable, the distance of chemical potentials between two points is adopted. Other normal type of axis variable can be selected here. This makes it possible to compare the drawing line with other type of profile diagram drawn by the fixing particular activity.