-
H. Yokokawa, N. Sakai, T. Kawada, M. Dokiya,
Generalized Electrochemical Potential Diagrams for Complex Aqueous
(M-X-H-O-e-) Systems, J. Electrochem. Soc. 137, 388-398 (1990).
doi:10.1149/1.2086451
-
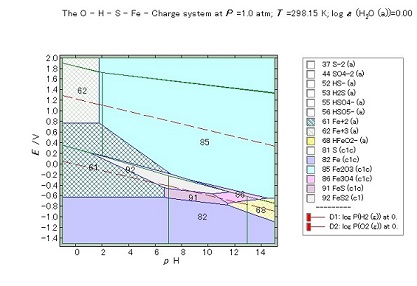
(1)The Pseudobinary Pourbaix diagram in the pH-E/V-{log a(S)-log a(Fe)} plot.
-
The Z axis is completely ignored in the pseudobinary system.
The stable polygons for the S containing but Fe non-containing species are treated
as transparent polygon tiwh netword bone structure.
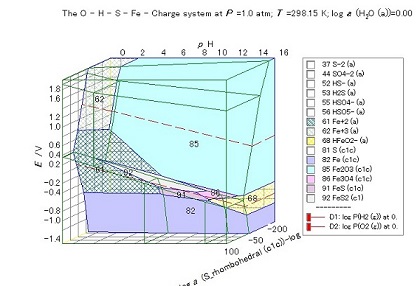
(2) the normal threedimensional Pourbaix diagram.
-
The same equilibrium relations are plotted in the three dimensional coordinates.
It is clearly indicated that the transparent sulfur species are located
in the left-hand side in the Z axis.
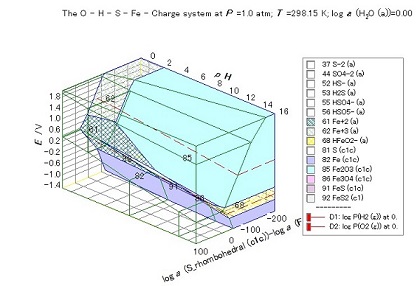
(3) the triangle type three dimensional Pourbaix diagram.
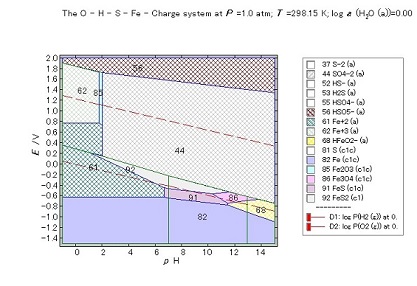
(4)the pseudobinary Pourbaix diagram under the management of transparency.
to top Details
- When the three dimensional Pourbaix diagram is constructed for the M1-M2-O-H-e- system,
the third coordinate is needed. In the CHD, the difference of the logarithmic activity,
log a(M1) - log a(M2) is adopted. This is just because CHD was developped initially to
faciliate the use of the high temperature chemical potential diagram in the high
temperature materials fields.
-
Other selections can se adopted. For example, in the mineralogy,
it is common to use the logarithmic activity of ionic species.
To change the third coordinate,
Project > Specify Diagram and
Coordinate SelectionIn in [Diagram Specification]Dialog is prepared. - To inspect inside the 3D Pourbaix diagram, there are several tools prepared in CHD;
- Dissections;
-
Run > One Dissection
- Rotation;
-
Diagram > Rotation
- Transparent;
-
Popup Menu: Transparent on / off
- Dissections;
- On the other hand, the Pourbaix diagram for the multiple elements have been
constructed by focusing the particular element among the targetted elements M1 and M2.
In CHD, the same treatment can be adopted by taking the following procedures;
- Construct first the graph for representing the equilibrium relations
in the thermodynamic space.
- Constrct the 3D Pourbaix diagram by using the three coordinates.
- Adopt M2 element as transparent, whereas adopt M1 element as the target element.
- All polyhedrons relating to M2 not to M1 are made transparent and
display the diagram.
- Construct first the graph for representing the equilibrium relations
in the thermodynamic space.
- Even though the 3D Pourbaix daigram is given as the pseudobinary diagram, other manipulations on the 3D diagram can be applied as described above.
to top Description
-
[System] MALT 
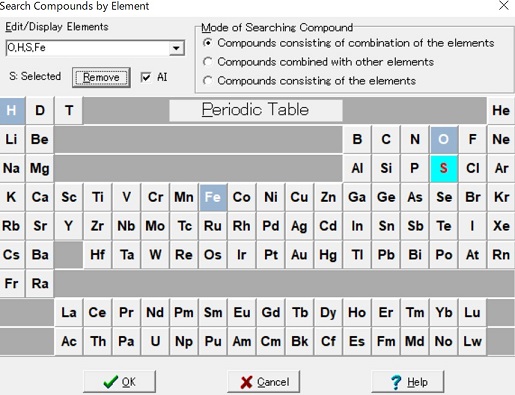
Search Compounds
-
Selection of <Fe,S,O,H> system with aqueous species
| MALT |
|
Tools > CHD | with CHD parameter of "/md" |
- CHD starts to do the first task of "Malt Direct."
- For the aqueous system, the default setting was made to
construct the Pourbaix diagram at 298 K.
- Automatically starts to run the calculations.
- The diagram was constructed under the default conditions and will be
displayed immediately after finishing all procedures.
|
|
Diagram > Range |
- The diagram (1) was obtained after the
change in coordinates range
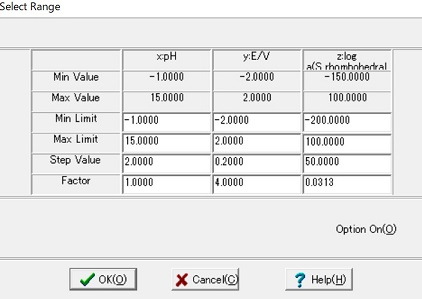
- pH and E/V were short-cut to make a more compact diagram.
- log a(S) - log a(Fe): Change was made to eliminate unnecessary line in the right-upper corner.
|
|
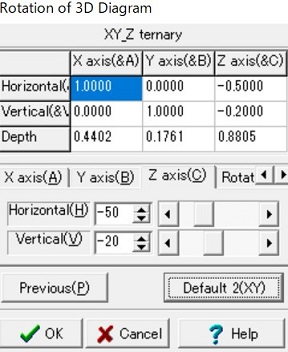
Diagram > Rotation |
-
Click the Default 1XY button;
- After Clicking the default button, the message will be changed for next option.
- The matrix values are for the Defaut 1XY_z.
- The diagram (2) was thus obtained.
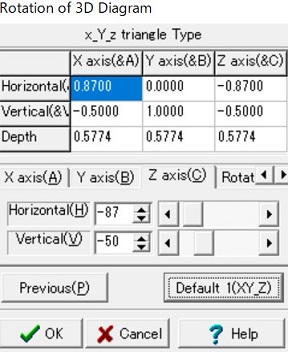
- The matrix values are changed for the Default 3x_Y_z.
- The diagram (3) was obtained.
- start with the diagram (1).
- place the mouse on the legend and make right-click.
- Popup Menu: Legend Plane
will appear in the vicinity of the mouse.
- Transparent on will be clicked.
- As a result, the display mode turns to be Touch Diagram .
- On moving mouse inside the legend, the pointed species name is given in the
message bar in the main form.
- By clicking on one species/compound, the transparency can be changed. If this species is normally painted, this becomes to be transparent. If transparent, it will be pained normaly.
- In the legend, the transparent species is expressed as the white color.