Graph Inspector Form
Graph in CHD
- CHD first constructs the Graph in the thermodynamic Space consinting of temperature, pressure and elemental chemical potentials. As the next stage, those values associated with a graph convertes to a diagram consisting of the graphic parts such as polygon and polylines. Thus, one diagram (chemical potential diagram or profile diagram) has the respective graph.
- Construction starts with making the frame cut by the lower and the upper limits of the thermodynamic variables (temperature, pressure, elemental chemical potentials). When temperature and pressure are fixed at certain values, the frame is also limited so as to have always the fixed temperature. Within such a frame, we consider the equilibrium conditions for a multiphase system. The individual compound having the fixed stoichimetry can be expressed by the flat plane in such space. Several phases thus compose a polyhedron. This can be regarded as Graph consisting of vertices, edges and facets.
- After construction of Graph, modification should be made to display in the diagram having the given coordinates with the lower and upper limits.
- The final graph is therefor some mixture of truely thermodynmic equilibriuim relations, the frame-related information and the coordinates derived information. For example, a vertex can be regarded as the thermodynamic point in which the thermodynamic variables are all uniquely determined. Within the range of the coordinates, this is completely right. However, on the edge of the diagram coordinates, such vertices are also characterized as the coordinate related properties. In some case, the frame property of the thermodynamic space will appear. In what follows, such additional but non-thermodynamic information is also included. In some cases, those are regarded as dummy.
Description of Graph Inspector
- This gives the information of the target graphs in the focused diagram. Note that the focused diagram is indicated by the red square in the upper-left-hand corner of the display panel. When CHD has several displaye panels and they show different digarms, respectively, the target graph which will be given in this grah inspector is exactly corresponding to those diagrams in the focused panel.
- When the main graph (and therefore main diagram) has the dissections, those associated graphs are also available to be shown here.
- This form consists of the Main part, the vertices page, the edges page, and the facets page. These are separately shown in respective pages.
(0) Main
- Target Graph
This is the target graph to be inspected.
Usually, the main graph is the target one.
When dissected graphs are available, those graphs can be also targeted.
Available graphs are always given in the combobox list.
- Page Control:
For those Graphs in the chemical potential diagrams, the following four pages will appear
(1) Vertices page,
(2) Edges page,
(3) Facets page,
(4) Compounds page.
On the other hand, for those Graphs in the profile diagrams, the only vertices page will appear. For providing the values corresponding to the respective vertices(points), the check box is shown.
(5) Vertices for Profile page.
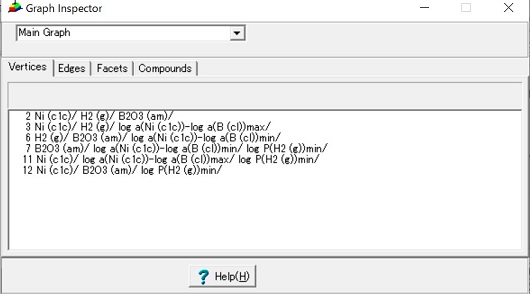
- Vertices Page

This gives the list of vertices.
Listed items are the number of the vertex and the name of planes consisting of the vertex.
When the CHD options / No detailed data is needed is checked, the only real vertices will be list up. When this option becomes unchecked, the dummy vertices including the Frame planes composing the thermodynamic space will appear. Such dummy vertices are marked by asterisk in the top of each line.
For example, D:Cr:L means the dummy compound introduced to give the low limit of the dimension-type coordinate for Cr element.
On clicking on the target vertex line,
Pop up menu is prepared for Vertex Option as follows:
- Points List
[List of Points] Form will appear to show data for all vertix points.
- Copy Table
The information of list will be copied. If the all numerical values for respective points are needed, the above menu shuold be selected and the table content of the
[List of Points] Form should be copied to clipboard.
- Edges page
To Top,
To Main ,
(1) Vertices page,
(2) Edges page,
(3) Facets page,
(4) Compounds page,
(5) Vertices for Profile>/a> page.
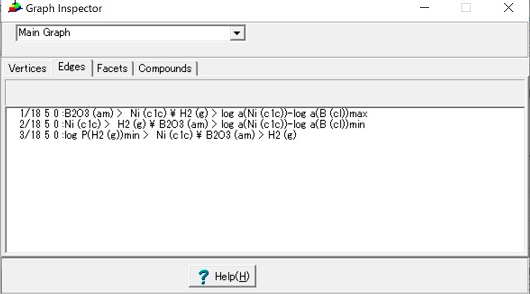
This provides the list of edges.
Edges are defined as lines connecting two vertices.
Those two vertices contain common phases(planes) and uncommon two phases can be regarded as the respective end phases:
Thus, edges are represented using theose common phase and the end phases as
One phase > common phase 1/common phase 2 .. < Another phase.
Here one phase and another phase represent the end phase of edges.
When the edge contains dummy phase, asterisk is given in the left hand side of line. This is the same as those given in Vertices page.
Edges can be characterized as straight or curved.
Straight edges are described with only two vertices, whereas there are many additional vertices for curved edges.
On clicking on the edge field, a list of vertices contained in the target edge will be displayed in the [List of Points] Form.
- Facets page
To Top,
To Main ,
(1) Vertices page,
(2) Edges page,
(3) Facets page,
(4) Compounds page,
(5) Vertices for Profile page.
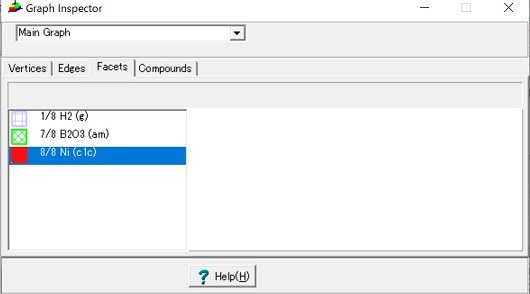
The facet consists of many vertices which forms a closed ring.
Those vertices have the common phases. When the three dimensional surface or the two dimensional diagram is formed, the common phase is defined as one phase, whereas the three dimensional diagram provides two common phases.
The list of facets displays facets avilable in the target graph.
When the common phases are all dummy or fixed, asterisks are again given on the line.
On clicking on the facet line, all vertices involved in the target facet will be shown in the [List of Points Form].
Respective facets are divided into the visible and the invisible ones. The visible facets are colored with selected colors, whereas invisible facets are seen from the rear side, these are painted with gray. On the left hand side of the list, those colors are painted.
Clicking on one line provides other following effects:
- Display the shape of the clicked facet in the Facet-Display panel in the right-hand side. The border line between the list of facets and display panel can be moved using
Split. Since the facet will be displayed about the same location in the panel, the panel should be large enough to show the target facet.
- Change the color of facet. On clicking the facet line in the list, the transparency of the facet in the diagram will be switched between on and off. Correspondingly the facet in the Facet-display panel is also changed in color.
- Compound page
To Top,
To Main ,
(1) Vertices page,
(2) Edges page,
(3) Facets page,
(4) Compounds page.
(5) Vertices for Profile page.
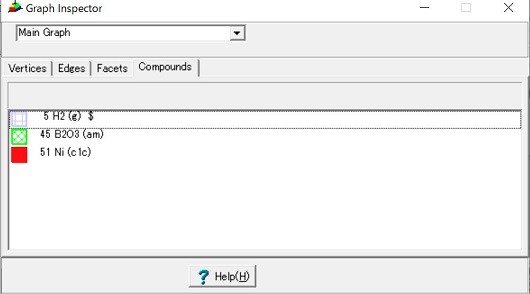
From the constructed graph, the phases involved in the graph can be extracted. Theses phases are given in the compound page.
In the list of Compounds, the extracted compounds are listed with the same color as those in the diagram.
On clicking the compound line, the facets associated with the compounds will be changed in switch of transparency. In the two dimension chemical potential diagram, or the three dimensional surface diagram, only one facet is associated with the target compound, whereas in the three dimensional diagram, several facets are attributed to one compounds. Those facets are simultanesouly changed in transparency. This function is the same as when the popup menu Legend Plane Transparent on / offis selected as "on" and then the compound line in the legend is clicked.
- Vertices for profile graph
To Top,
To Main ,
(1) Vertices page,
(2) Edges page,
(3) Facets page,
(4) Compounds page.
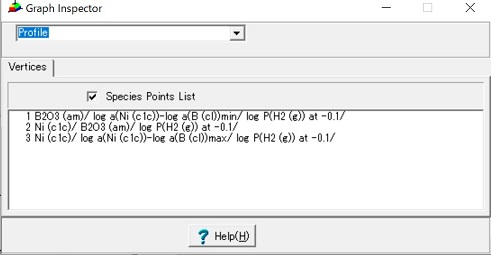
This is the vertices page for the profile graph. In addition to the normal vertices page, the check box for Species Points List is prepared to provie the [Chemical Potential Table] Form for the multiple vertices. This is essentially the same information as given by the List of Points form.
The numerical data created by manually selected point in the menu Diagram > Display Mode > Draw Line can be also presented in this page.
