-
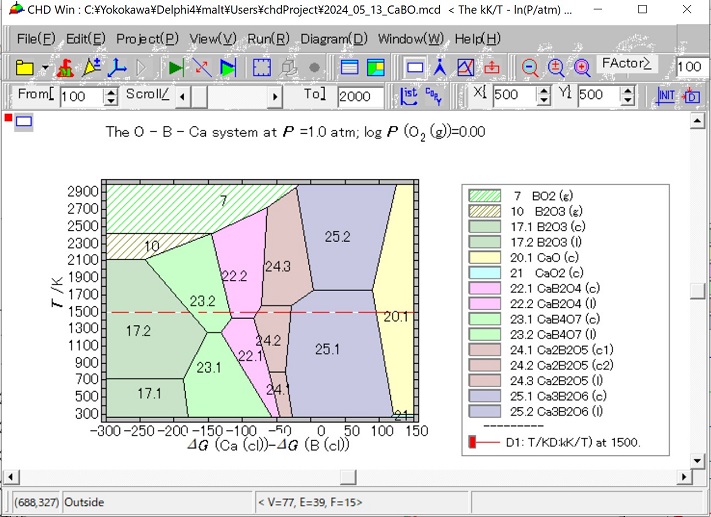
(1)The two dimensional diagram in the {log a(Ca)-log a(B)}-T plot should be first constructed.see Related Diagram 7a
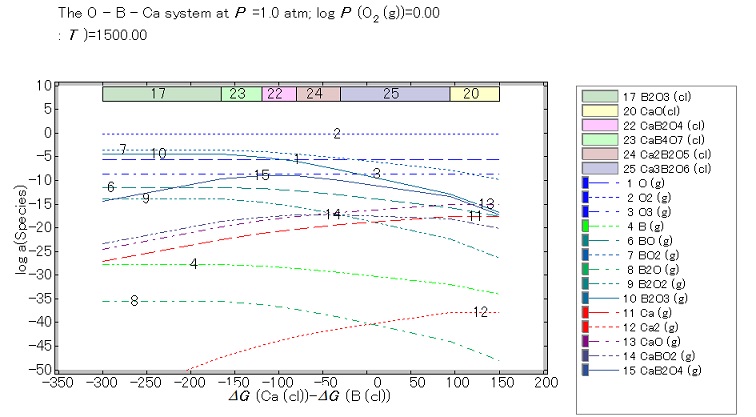
- The Profile diagram in the second diagram display form.
- The chemical potential diagrm after dissection in the Mainform.
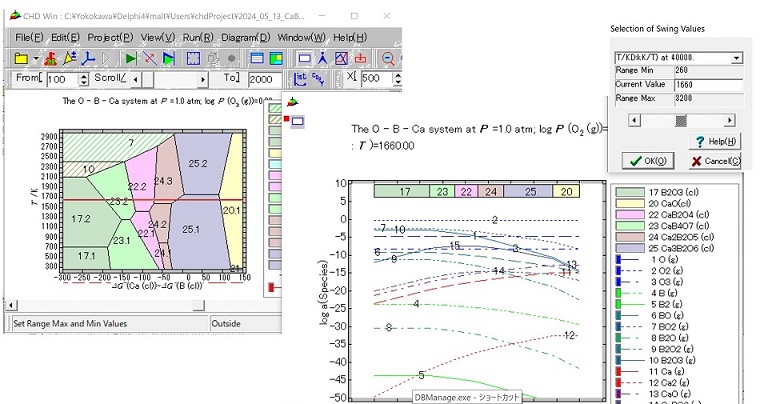
- Swing the dissection
(2)The profile diagram which indicates the partial pressues of respective gaseous species is set up by selecting the dissection conditions; that is, T = 1500 K.
Related Diagram to top Details
- The partial pressures on the solid materials can be exactly given, whereas those on the liquid materilas should be taken as tentative values. This si because MALT does not treat liquid mixtures properly. In this figure, the liquid state is expressed as that of the particular compound at the fixedcomposition. This is apparently crude.
- Even so, it is convenient to know how those values depend on temperature etc.
- When the main chemical potential diagram was set up by selecting other activity values than unity, it shuold be careful to look at the profile diagram. The maximum values of the partial pressures can be limited at the values defined in the main chemical potential diagram.
to top Description
-
Follow the details of Related Diagram
- Sometimes, the vertical axis does not show enough height. In such a case, the vertical height can be adjusted by usin the move location mode in the
 Diagram > Diagram Mode > Move Location.
- Since the profile diagram is displayed in the separate Form, the focus of the manupulation should be set by clicking on the diagram in the separate form. When focus is located on the separate form, the red squar appears on the upper right corner together with the current available diagram mode (see Figures above).
- After this specification, click on the CHD mainform, not on the Main diagram but on the tool bar region. In this situation, an appropriate mode can be selected without loosing the focus on the separate form.
- Swing dissection value can be made by selecting
-
the
Run > Swing Dissection
- or, Check the check box for Dissection swing in the Diagram Specification Form.
- Then Selection of Swing Values form appear.
- Whenever the swing value is changed, corresponding profile diagram in the separate form will be changed and also the dissection line in the main chemical potential diagram will change according to the selected value.
|
|
Run > Dissection |
Diagram Specification Form with Dissection page will appear as follows:
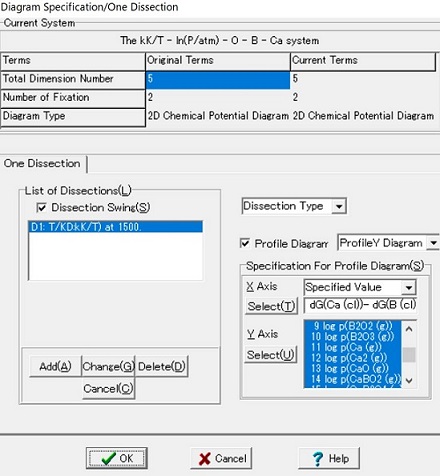
Select Temperature and define the dissection value as 1500 K.